Your Journey to Dynamics 365 Starts Here!
Fill in your business details and let
us be your partner in growth.
Explore this complete Power BI Handbook for Small and Medium-Sized Businesses (SMBs) looking to turn Complex Data into Actionable Insights with Interactive Reports, Predictive Analysis, AI-Powered Insights, and More.

It's a fact that the world of today is different from the world before. This is the age of digital acceleration.
Every enterprise, from healthcare, remote work, economics, and education to the manufacturing sector is generating an incredible amount of data every day. This data in millions (or billions) disparate pieces of information is then visualized and used for informed decision-making; which means - decisions based on numbers and insights.
Before data visualization techniques, people used to make decisions based on intuition - gut feeling, personal experiences - expert opinions, and limited information - historical data.
This approach is subjective and lacks the rigor and impartiality of data-driven decision-making.
With the advent of data visualization tools like Power BI, decision-making has become more informed and effective, leading to better results and improved performance.
Business intelligence (BI) tools or data visualization tools like Microsoft Power BI are now integral for small or medium-sized businesses. These BI tools are transforming the way businesses make data-driven decisions.
Because these tools have user-friendly interfaces and a wide range of features. Microsoft's Power BI has emerged as one of the most popular BI platforms on the market because of its faster data analysis capabilities and the ability to connect to various data sources.
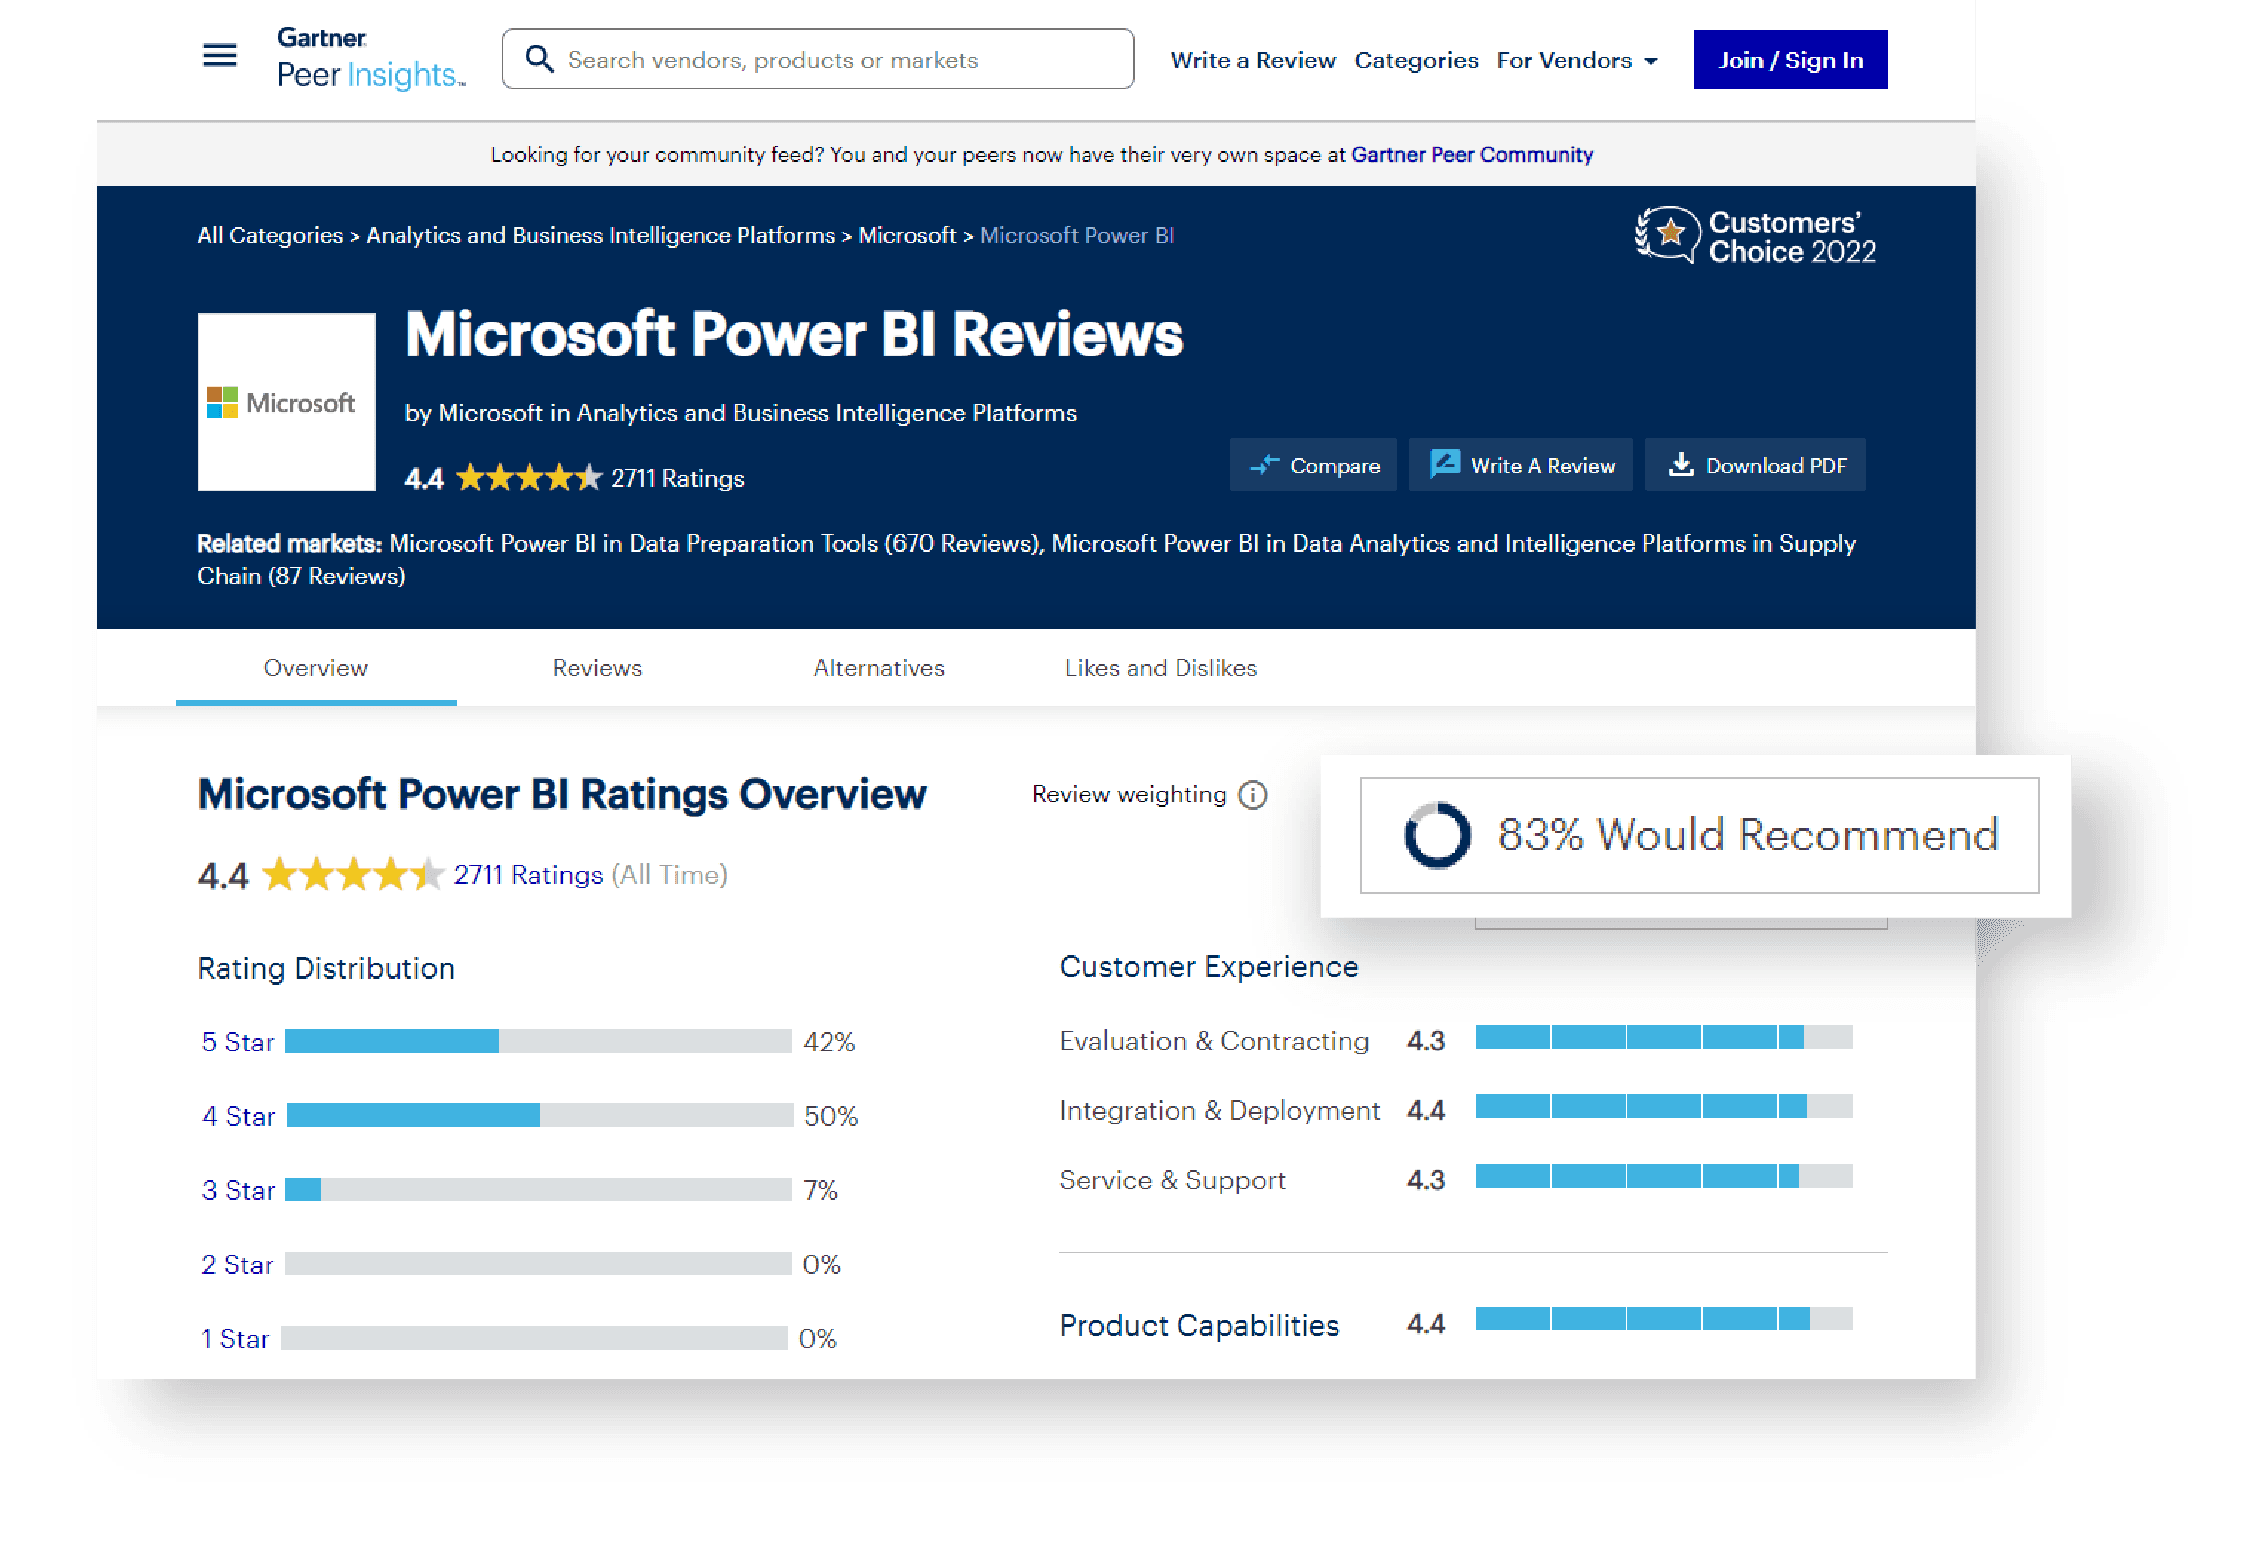
According to Gartner, about 83% of all active users would recommend Power BI:
Eager to Explore More About Power BI?
Download and read our FREELY available Power BI User Guide to enhance your data analyzing capabilities and derive business growth with informed decision-making.

In this episode, you'll learn about Power BI, it's bit history and overall journey so far.


Microsoft designed and developed Power BI for helping businesses with business intelligence (BI) capabilities.
The innovative application of Power BI was first conceived by Ron George under the project name "Project Crescent", back in 2011. It was later developed and brought to fruition by Amir Netz and Thierry D'Hers.
Aiming at powering organizations to transform their data into actionable insights. This BI platform has a rich history dating back to its introduction in Sep 2013, as part of Microsoft's suite of business intelligence tools, such as Power Pivot, Power Query, and Power View.
And from July 24, 2015, Power BI was available as a Microsoft product to download for the public with different versions of web, desktop, and mobile apps.
Since then, Power BI has evolved significantly, incorporating features such as data visualization, data modeling, and real-time data streaming, making it one of the most versatile and comprehensive BI Platforms on the market today.
With an intuitive user interface (UI) and a wide range of integrations with other Microsoft tools and services, Power BI empowers businesses of all sizes to turn data into meaningful and actionable insights.
It allows you to make informed decisions and drive growth.
Whether it's exploring data with interactive reports, creating dashboards to watch key performance indicators, or using machine learning algorithms to make predictions, Power BI provides organizations with the tools they need to unlock the value of their data and open doors for new business opportunities.
So, if you are a data analyst, a business decision-maker, or a developer, Power BI has something to offer for everyone.

This episode is all about deeply knowing about Power BI, its components, how it works, and case studies.

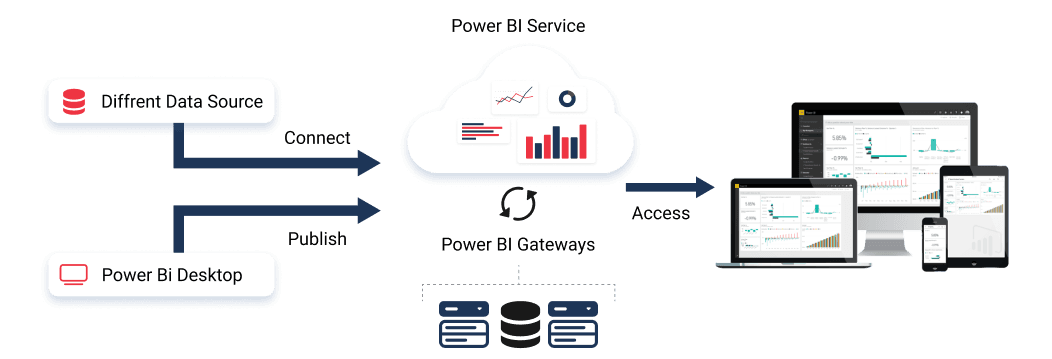
Microsoft Power BI is a sophisticated solution available as Power BI Service (an online version - Software-as-a-Service, a.k.a the SaaS version) for companies looking to unlock valuable insights from their data and expand the reach of their business operations.
The web-based suite of applications helps you have a comprehensive toolset for analyzing and visualizing information, including Power BI Desktop, Power BI Pro, Power BI Mobile, and Power BI Embedded.
With Power BI dashboards, you can gain real-time access to critical data metrics, and the solution's integration with Excel, SharePoint, Microsoft Teams, and Office 365, enabling seamless collaboration across your different teams.
Power BI's smart Q&A feature, along with its 59 pre-built connections to popular apps and services, make it easier than ever to gather and unify data from various sources.
Developers, business analysts, IT professionals, and other business users can rely on Power BI to create a holistic view of their organization's metrics and effectively share their insights.
Companies can make informed decisions, drive operational efficiencies, and remain competitive in today's rapidly evolving business with this robust BI solution.
What are the components of Power BI?
Power BI enables organizations like yours to analyze and present data in an interactive and meaningful way. It offers a range of features including data connectors, data modeling, report and dashboard creation, and collaboration capabilities.
Here are the components of Power BI that powers it:
1. Power Query:
Power Query is a data transformation tool that enables users to find, refine, connect, and combine various data resources. It supports a wide range of database formats, including Oracle, MySQL, SQL Server, and more.
Power Query is integrated with Power BI Desktop and Excel for better data visualization.
Power Pivot:
This is a data modeling engine that enables users to create data models, share insights, manage relationships, and perform calculations. It runs on DAX (Data Analysis Expression) to perform both simple and complex data calculations.
3. Power View:
It is a feature that allows users to filter and present data in a visually appealing way, such as charts, graphs, bars, etc. Power View connects multiple data sources to enable data visualization. It is a standard feature of Microsoft, available in Power BI, Excel, SQL Server, and SharePoint.
4. Power Map:
This Power BI feature uses Bing Maps (now driven by Microsoft's own artificial intelligence - AI) to create 3-D data visualization and mapping on Power BI and Excel. It uses various location factors, such as latitude, longitude, street address, city, state, and country, to accurately display data in a 3D format.
5. Power BI Desktop:
Power BI Desktop is the primary development application for creating Power BI Components, such as Power Query, Power View, and Power Pivot. It allows users to create BI reports and make changes to the data processing.
6. Power BI Web:
Power BI Web is designed for small and medium-sized businesses, allowing them to publish data directly on the Power BI website using a web browser.
7. Power Q&A:
This feature of Power BI allows users to search for data or query the data using natural language (also termed natural language processing or NLP in the field of Data Science). This makes finding data easier by simply asking a question, instead of manually searching through piles of files for the desired information.
Overall, Power BI helps organizations to turn data into actionable insights and quickly make informed decisions at scale.
Case Studies
Case -1: Dell Technologies
Dell Technologies leverages Microsoft 365 to modernize work for its global employees and improve its culture and eNPS scores.
“We're driving Microsoft 365 as a foundational suite of tools for enacting our vision for a modern, seamless employee experience. We moved from 30 or so tools to 6 or 7 over the last two years. Srikanth Ramaswamy, Global Lead for Modern Content and Collaboration Services and a member of the Dell Digital Team Experience, said - by integrating and prioritizing the use of Microsoft's products such as Office 365, Dynamics 365, Power Platform, and Azure, the employee satisfaction Net Promoter Score improved by over 60% within 6 quarters.
Case - 2: bp - A Global Energy Giant in Oil & Gas Production
With a modular data mesh design on Microsoft Azure, BP ignites greater innovation.
BP and Microsoft teamed up to modernize BP's data lakes with the Microsoft Intelligent Data Platform. The solution is a modular data mesh combining Azure Databricks, Azure Synapse Analytics, Microsoft Purview, and Power BI, making it a leading cloud data platform that integrates databases, analytics, and governance to increase value creation.
“Modularity is at the heart of bp's digital approach to drive an integrated set of world-class customer experiences, reduce the time to value for new products, and enable bp to create new businesses.” - Abeth Go: Vice President for Data & Analytic Platforms.
Case - 3: Rolls Royce
Rolls-Royce revolutionizes efficiency with the Power Platform.
Power Platform, consisting of Power Automate, Power BI, and Power Apps, has become the most popular solution for upskilling at Rolls-Royce, with a 30% uptake in training consumption.
“The results have been outstanding, with an estimated £8 million financial profit within a matter of months, with growth expected to continue as more teams adopt the platform,” says Elena Walker: Digital Manufacturing Leader at Rolls-Royce.
Case - 4: T-Mobile - A Wireless Services Giant
T-Mobile uses Azure Synapse Analytics and Power BI for its 5G rollout.
Azure Synapse Analytics and Power BI are the tools that help you with insights and data-driven decision-making to drive progress forward. Azure Synapse Analytics analyzes vast data, while Power BI creates interactive visualizations. These tools are powering T-Mobile's 5G journey and bringing the future of connectivity to customers.
"With Azure security groups, [managing security] became a much easier task. Managing permissions … is easier to manage than going through a traditional security portal,"" says Vardhaman Patil: Senior Business Intelligence Manager at T-Mobile.
Case - 5: New York City Department of Education
The New York City Department of Education successfully meets the challenge with the help of Microsoft Azure.
The New York City Department of Education faced a huge challenge when the pandemic hit, affecting its 1.2 million students (about half the population of Arkansas). It was a crazy time.
To quickly improve its remote learning capabilities, the department built a cloud-based platform using Azure Synapse Analytics, resulting in high performance, easy management, and strong security. The platform helped the department effectively respond to the pandemic and support its students' education.
"The district used data to give student performance insights to over 100,000 educators and administrators via Power BI Dashboards. This allowed them to gather more detailed information, such as the number of students who logged into different platforms, to principals which was previously not possible," says Zeeshan Anwar: executive director of the district's finances and product engineering.

This episode is for SMBs to learn how Power BI can help them navigate vast amounts of data and turn it into meaningful insights.

It's 2026, and small businesses are still facing the growing challenge of managing voluminous quantity of data.
Power BI is the solution for this challenge, offering a complete suite of tools for data analysis, visualization, and insight sharing.
With Power BI, small businesses can have a 360-degree view of their data updated in real-time and presented in interactive visualizations. The platform integrates seamlessly with Excel and Office 365, making data analysis and collaboration effortless.
Power BI gives you a seamless experience to you to customize and access hundreds of pre-built connections to popular business apps and services. With its intelligent Q&A feature, your teams can quickly answer data-related queries, making this BI tool effortless to use.
Power BI is the right choice for small businesses in 2026 because it is a comprehensive, easy-to-use, and versatile solution that helps turn data into actionable insights and drive success and growth.
Let's see how Power BI can help.
1- Complete Data Analysis and Visualization Solution
Power BI is a web-based suite of tools for analyzing and visualizing business data.
2- Report Authoring, Content Creation, and Distribution
It is a complete solution for report authoring, content creation and distribution, data monitoring, and access to dashboards from any device.
3- 360-degree View of Real-Time Business Data
Offers a 360-degree view of real-time business data with interactive visualizations.
4- Easy Customization and Adaptability
Power BI has hundreds of pre-built connections to popular business apps and services for easy customization. Users can easily adapt to this BI tool since it has an easy learning curve.
5- Seamless Integration with Excel and Office 365
Integrates seamlessly with Excel and Office 365 for data analysis and collaboration.
6- Smart Q&A Function for Quick Data Insights
Features a smart Q&A function for quick answers to data-related questions.
7- Pre-built Connections to Popular Business Apps and Services
Power BI comes with pre-built connections for 59 apps and services including Salesforce, Google Analytics, Azure, and Zendesk.
8- Driving Success and Growth with Comprehensive Key Metrics.
Microsoft's Power BI gives a comprehensive view of key metrics for data-driven decision-making.
Pros and Cons of Power BI
Pros of Power BI:
Cons of Power BI:
Who can use Power BI?
Power BI is used by developers, business analysts, IT heads, and business users of all sizes for success and growth.
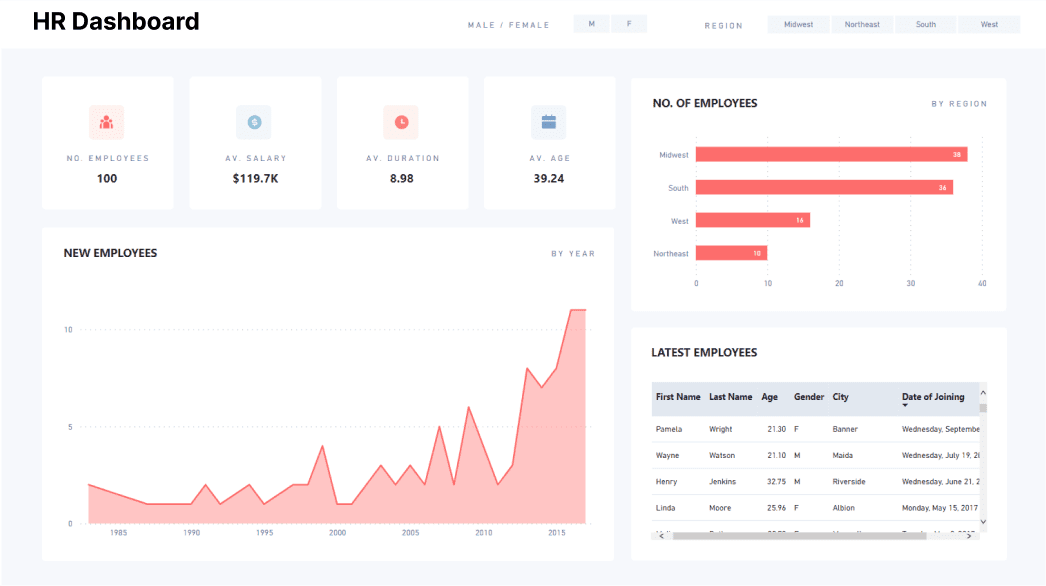
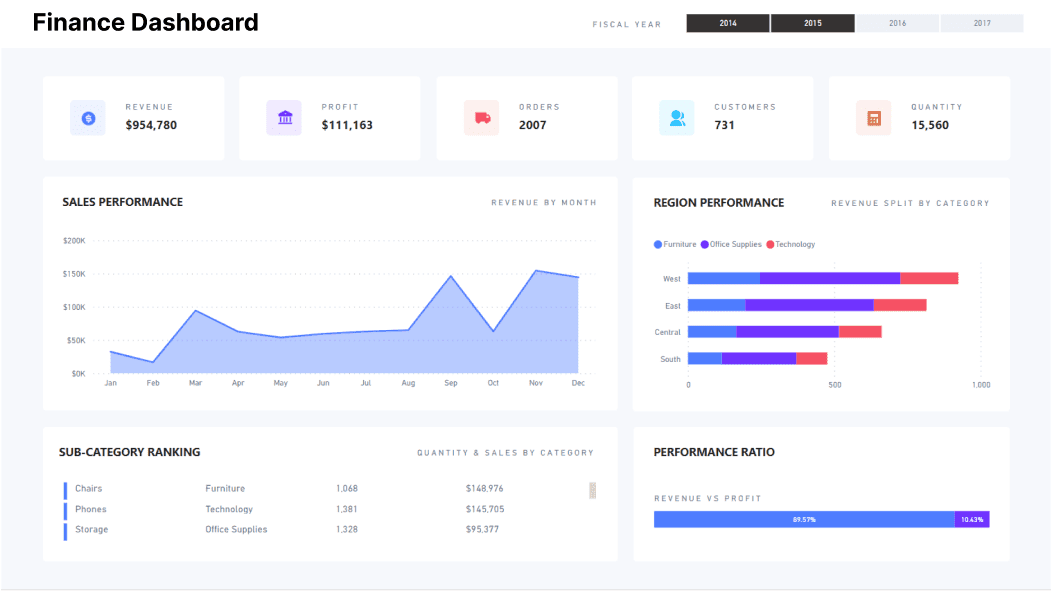
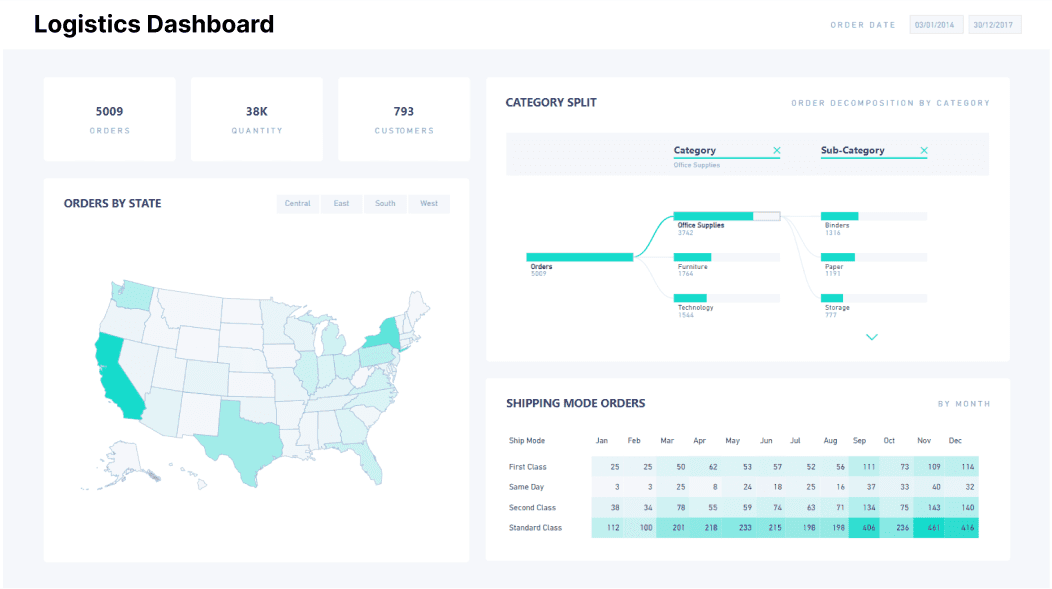
In this episode, we will cover how dynamic dashboards of Power BI are empowering business users to make informed decisions.
MSFT Power BI is a suite of business analytics tools that enables end users to visualize, analyze, and share data in a way that's easy to understand and act upon.
One of the key features of Power BI is its dashboards, which generate a real-time snapshot of an organization's data in a single view.
Let's explore the benefits of Power BI dashboards and how they can empower you to make the right decisions.
Also Read: Power BI for Mac: Learn how to use Power BI on Mac Devices?
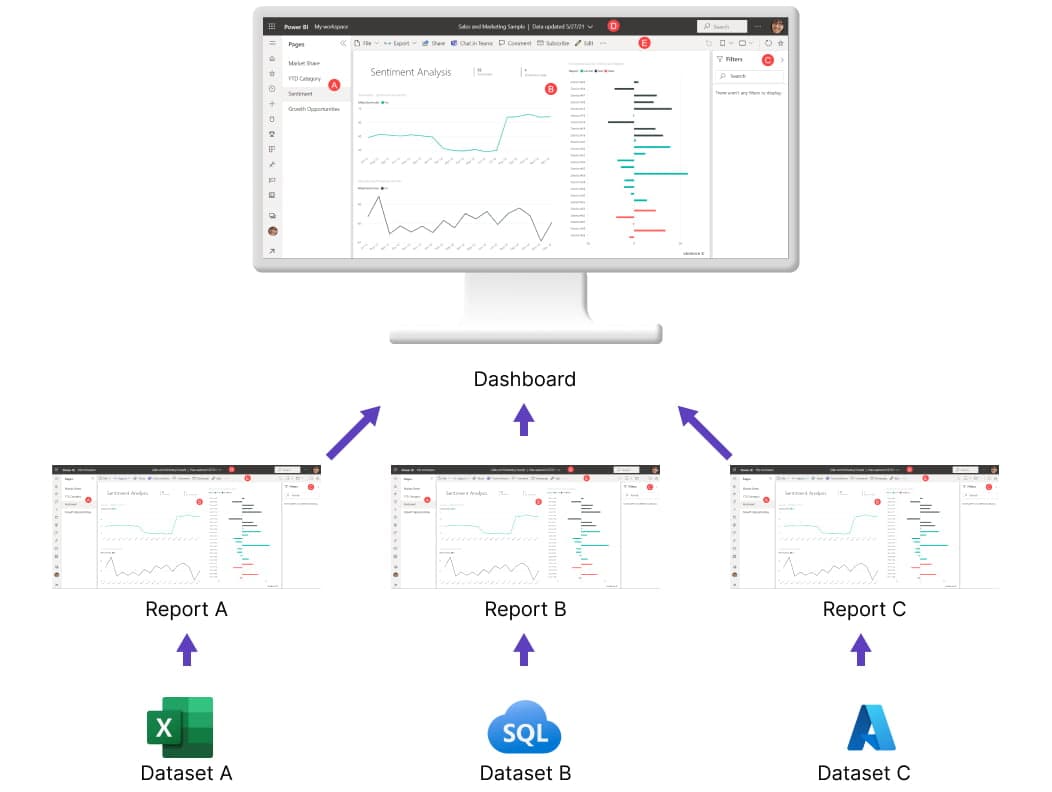
What is a Power BI Dashboard?
A Power BI dashboard is a customizable canvas that displays visualizations and data from one or more reports, showing you a high-level view of your data collected from different data sources.
You can create dashboards in Power BI from scratch or by using pre-built templates.
Once a dashboard is created, users can add visualizations, filters, and other elements to create a custom view of their data.
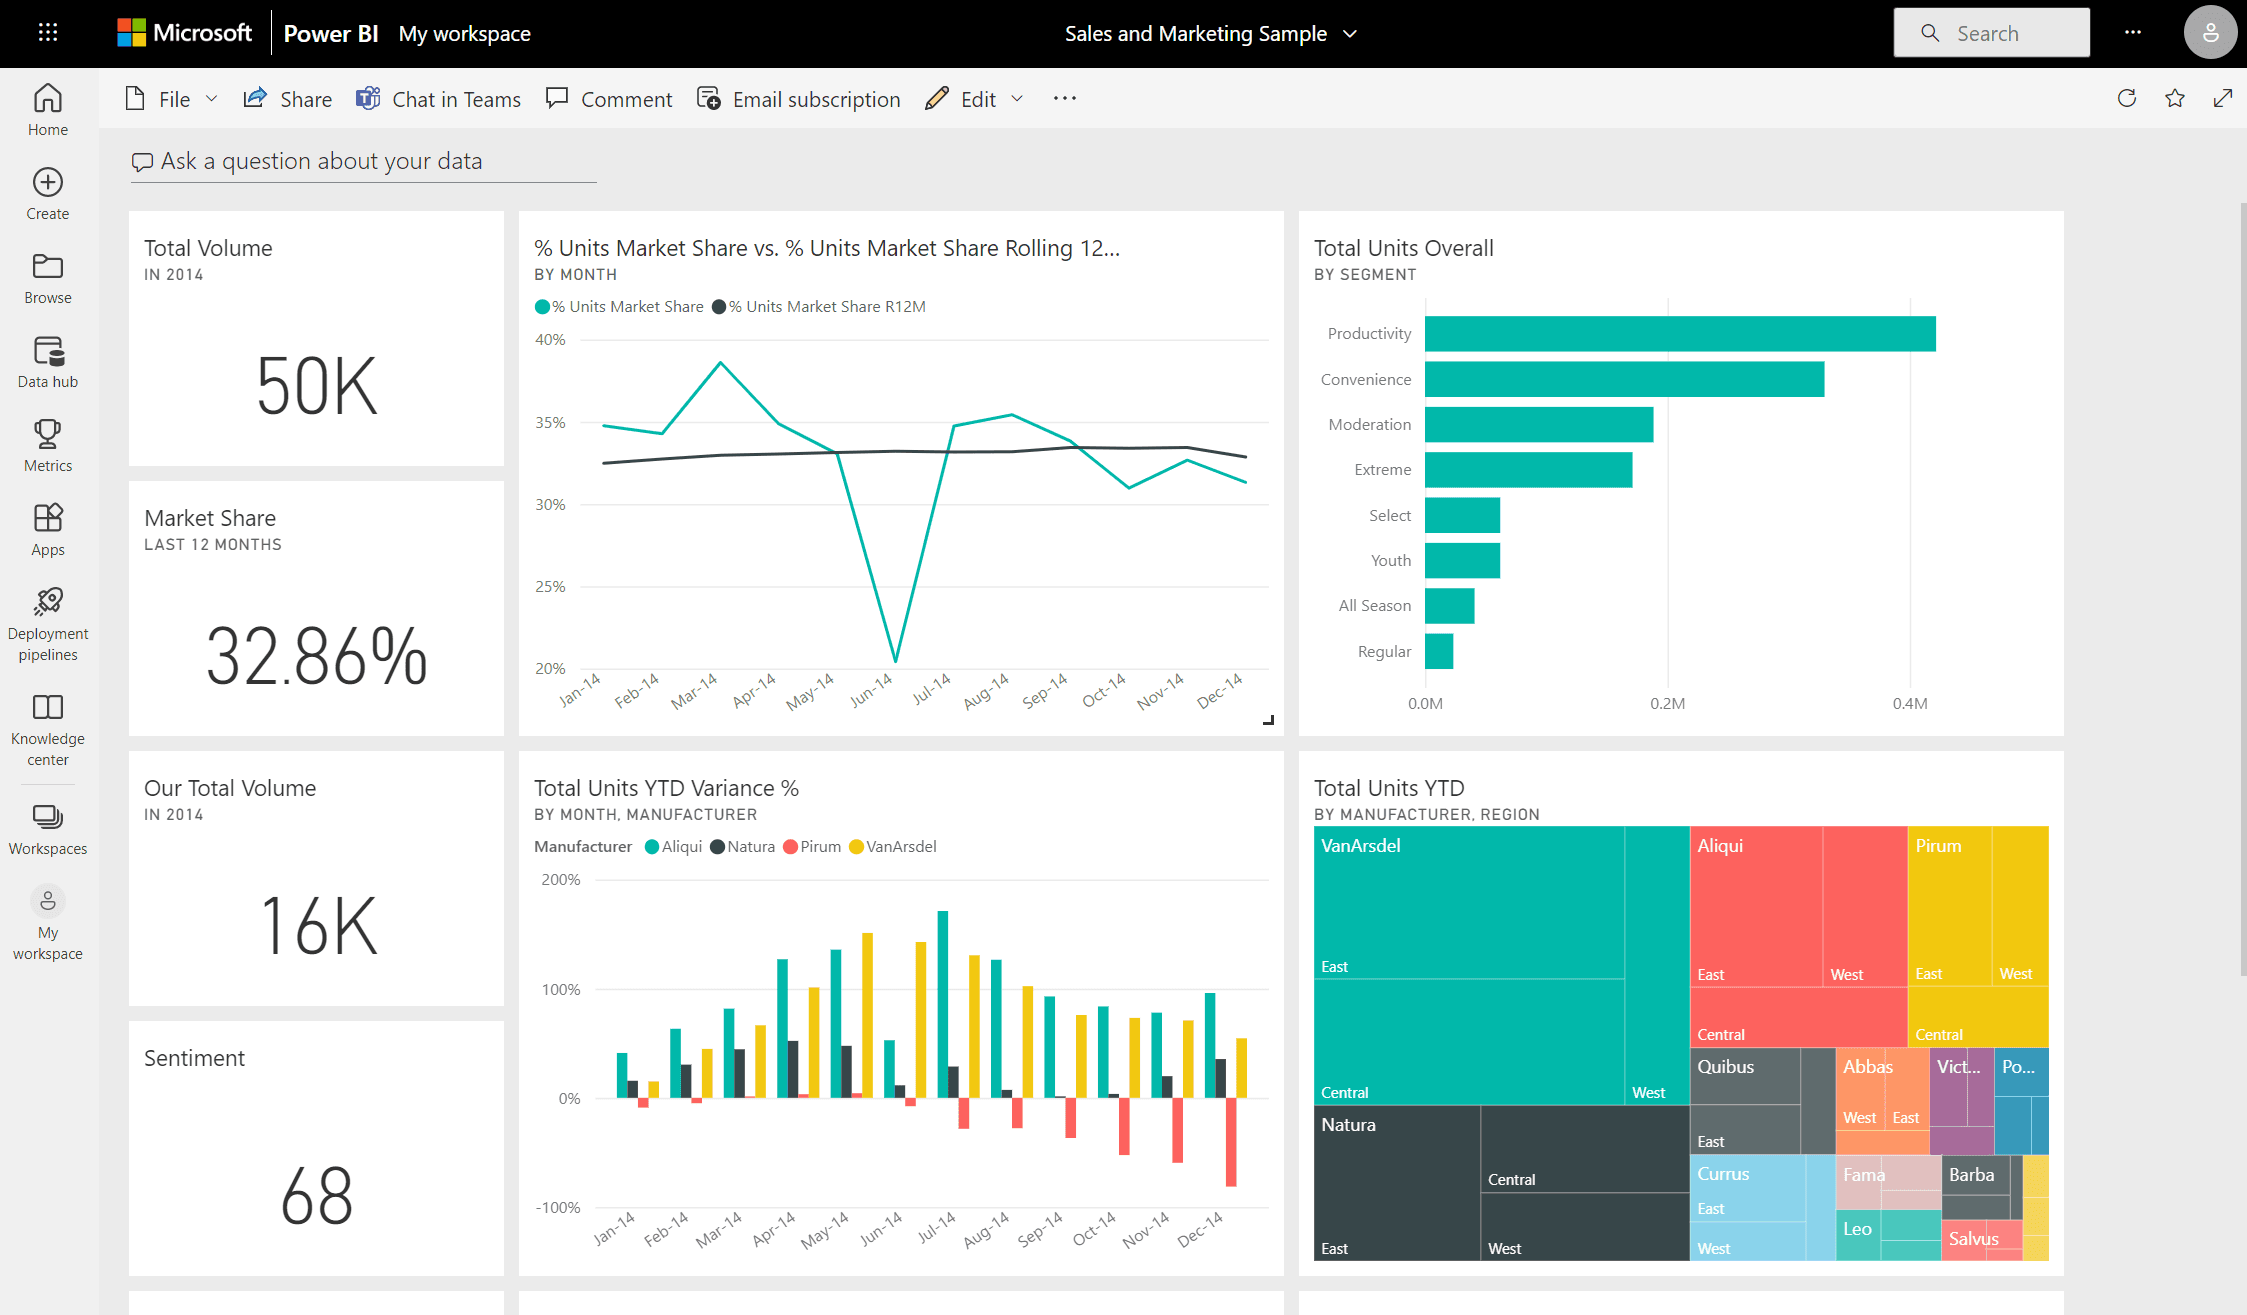
Power BI dashboards can be shared with others within the organization or even externally with your colleagues, partners, or customers.
Benefits of Power BI Dashboards
Power BI dashboards offer several benefits to end users, including:
Real-time insights: Dashboards allow a real-time view of an organization's data, so end users can make decisions based on the latest information available.
Customizable: Dashboards can be customized to fit the unique needs of each user, allowing them to see the data that's most relevant to them.
Interactive: End users can interact with dashboards by filtering, drilling down, or clicking on visualizations to explore the data in more detail.
Easy to share: Dashboards can be shared with others within the organization or even externally with partners or customers, making it easy to collaborate and share insights.
Mobile-friendly: Power BI dashboards are mobile-friendly, meaning end users can access their data from anywhere, at any time.
Use Cases for Power BI Dashboards
Power BI dashboards can be used in a variety of use cases, including:
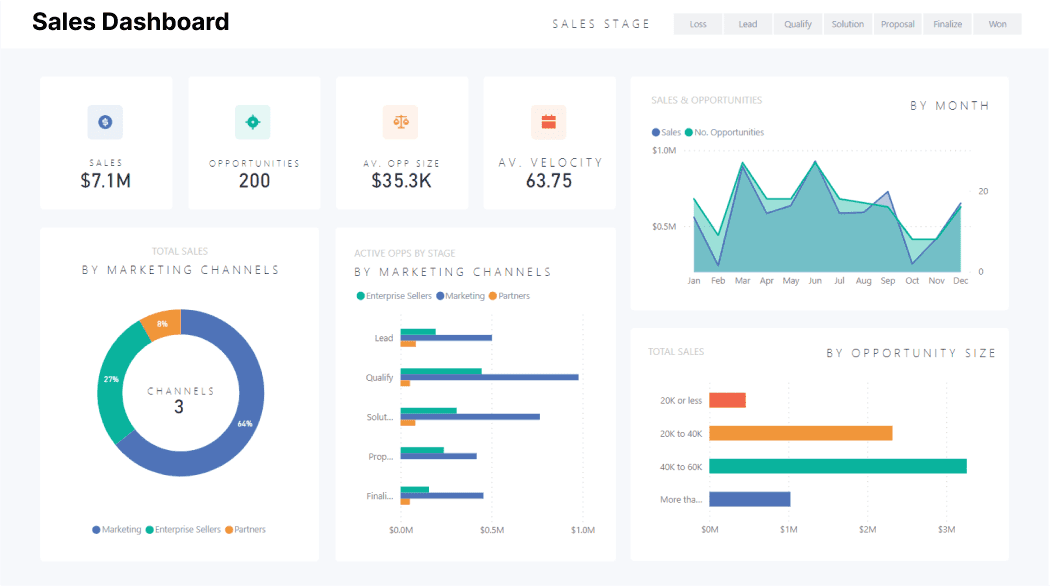
Sales: Sales teams can use dashboards to track their performance, show trends, and make data-driven decisions.
Marketing: Marketing teams can use dashboards to track their campaigns, check social media metrics, and find areas for improvement.
Finance: Finance teams can use dashboards to track key performance indicators (KPIs), monitor cash flow, and analyze financial data.
Operations: Operations teams can use dashboards to track production metrics, identify bottlenecks, and optimize workflows.
Power BI dashboards provide you with a powerful tool to turn your data into meaningful insights.
By getting a real-time, customizable, and interactive view of your data, you with your decision-making team can make informed decisions that drive business success.
Whether used for sales, marketing, finance, or operations, Power BI dashboards enable you to harness the power of data and unlock new growth and business opportunities.
This episode is about integrating Power BI to Microsoft Dynamics 365 apps like Dynamics 365 Business Central, Dynamics 365 Finance, Dynamics 365 Sales, or Dynamics 365 Supply Chain Management.

Power BI helps you build a cutting-edge enterprise powered by data and Artificial Intelligence (AI).
You can merge diverse data sources into coherent views and leverage analytics to prompt informed decisions, all while sustaining security and governance.
It is an all-in-one solution if you are looking for a business intelligence software, or a specific type of BI software, dashboard software, data warehousing software, reporting tools, data virtualization software, or a data analysis software to streamline your entire organization.
Let's see how integrating Power BI with an enterprise resource planning software (ERP) like Microsoft's Dynamics 365 Business Central helps you.
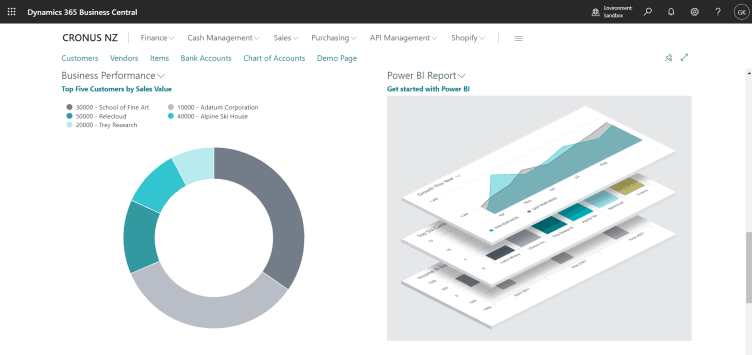
Integrating Power BI with enterprise resource planning (ERP) software like Microsoft's Dynamics 365 Business Central can offer many benefits to businesses like your e-commerce and manufacturing.
So, by using Power BI's powerful analytics capabilities, businesses can gain deeper insights into their commerce and operations and make data-driven decisions at pace.
For instance, integrating Power BI with Business Central enables manufacturers to merge data from various sources and visualize it in real-time. This enables them to name trends, patterns, and anomalies in their data, and take the right actions based on these insights.
Moreover, when integrated with Dynamics 365 apps, Power BI allows you to keep an eye on key performance indicators (KPIs) such as production output, inventory levels, and supply chain efficiency, and show areas for improvement.
It helps businesses optimize their operations, reduce costs, and improve customer satisfaction.
Hence, integrating Power BI with a CRM/ERP system can help manufacturers gain a competitive edge by enabling them to make better-informed decisions, optimize their operations, and stand-out from market trends.
Core Features and Versions of Power BI

Microsoft Power BI suite enables you to analyze data and share insights. There are four primary products within the Power BI suite:
Power BI Desktop: This is a Windows desktop application for authoring reports and creating data models. It enables users to connect to a wide range of data sources, including cloud-based and on-premises data sources.
Power BI Service: This is a cloud-based service for publishing, sharing, and collaborating on Power BI reports and dashboards. It offers features such as data refresh, collaboration, and sharing.
Power BI Mobile: This is a mobile app for accessing and interacting with Power BI reports and dashboards on iOS, Android, and Windows devices. It enables users to view and interact with data while on the go.
Power BI Report Server: This is an on-premises report server for publishing Power BI reports to an organization's own infrastructure. It provides a solution for organizations that require an on-premises reporting solution.
These four products work together to provide you with a comprehensive set of tools for data analysis and visualization.
You can use these data analysis tools to create interactive dashboards and reports, share insights, and collaborate on data-driven decisions.
All these versions of Power BI have the following features:
Pricing and Licensing of Power BI
Power BI is a powerful business intelligence software that helps you to analyze and visualize data in a way that is easy to understand and act upon. Whether you're a small business or own a large enterprise, Power BI has a pricing and licensing option that can meet your needs.
Power BI comes in two primary licensing options:
Power BI Free:
Power BI Free is designed for small businesses, independent professionals, and personal use. It allows users to create, view, and share interactive reports and dashboards with others.
Some of the features included in Power BI Free are:
Power BI Pro:
Power BI Pro is designed for larger businesses that require more advanced data analytics and collaboration features. It offers all the features of Power BI Free, plus additional capabilities such as:
Pricing:
The pricing for Power BI Pro is $9.99 per user/month, and it can be purchased through Microsoft's website.
In addition to Power BI Pro, Microsoft also offers Power BI Premium that costs $20 and has more features such as, the advanced AI capabilities to unlock self-service data prep for big data and data simplification and management tools.
On the other hand, Power BI Embedded starts from $4995 per capacity/month
Which license suits your business?
Power BI Premium is designed for organizations that require high-performance, scalable analytics, while Power BI Embedded is designed for ISVs (independent software vendors) and developers who want to embed analytics in their own applications.
Here you will learn about other data analytics and visualization tools than Power BI, and what is the difference between competitors of Power BI such as Tableau or Qlik View.

Today, data is the backbone of every organization, and needs a powerful tool to draw meaning from their data and turn that into valuable insights.
To do this, you have other ways to visualize your data besides Power BI.
Some of the most popular options include:
Tableau: Tableau is a data visualization tool that enables users to create interactive dashboards, visualizations, and reports. It offers a wide range of data connectors, including cloud-based and on-premises data sources, and supports real-time data analysis.
Also read: Power BI vs Tableau: Which is best for my small business in 2026?
QlikView: QlikView is a business intelligence tool that allows users to create interactive reports and dashboards. It uses an in-memory data processing engine, which enables faster data analysis and visualization.
D3.js: D3.js is a JavaScript library for creating dynamic, interactive visualizations in web browsers. It has a wide range of visualization options, including bar charts, scatter plots, and more advanced visualizations like force-directed graphs.
Excel: Microsoft Excel is a popular tool for data analysis and visualization. It offers a range of charting and graphing options, including columns, lines, and pie charts.
Google Data Studio: Google Data Studio is a free data visualization tool that enables users to create interactive reports and dashboards. It supports a wide range of data sources, including Google Analytics, Google Ads, and many more.
R: For statistical computing and graphics, R is a programming language. It gives you a wide range of visualization options, including scatter plots, heat maps, and more advanced visualizations like treemaps.
Each of these instruments has particular advantages and disadvantages. Though the best way for visualizing data will depend on the specific needs of your requirements, Power BI is an easy, low-cost, and low-labor choice for organizations in 2026.

This episode will educate you about how much Power BI has changed and what's new in it for you.

Below are the updates in Power BI which were released in December 2022.

Reporting
The latest Power BI update has relocated slicer-type formatting to the Format Pane.


Data connectivity
Various updated data connectors to ease your data analysis.

Here, you get yourself enlightened about the scope of Power BI for SMBs.

For small and medium-sized businesses, the importance of data analysis cannot be ignored.
In today's competitive market, data is the backbone of every organization, and analyzing it is essential for verifying operational efficiency and making informed decisions.
This is where Power BI comes in, as it allows businesses to sort and analyze their data sets and create trustworthy analytic reports that can drive significant improvements in overall business success.
As a result, the demand for Power BI programmers is set to keep rising, as the role of a Power BI developer is crucial in any organization.
The business intelligence market was valued at $21 billion (about $65 per person in the US) in 2020, and it is projected to grow to $41 billion (about $130 per person in the US) at a compound annual growth rate (CAGR) of 12% by 2026.
If you have proven ability in this field and have relevant knowledge and certification, you can expect to find promising job opportunities in renowned organizations.
With experience, you can also look forward to better job roles and higher Power BI developer salaries, making for a rewarding and fruitful career path while also helping organizations of seizes with right reporting and data analysis.
Power BI is indeed a powerful and user-friendly tool for small and medium-sized businesses to analyze and visualize data, providing valuable insights into their operations, customers, and market trends.
As businesses generate more data, Power BI's ability to integrate with cloud-based solutions like Business Central and analyze data in real-time will become increasingly valuable.
Its advanced visualization capabilities will also improve, making it easier to figure out key trends and insights.
Power BI enables data-driven decisions, giving businesses a competitive edge in a rapidly changing business world.
And its evolving capabilities make it an asset for businesses looking for long-term success and growth.


